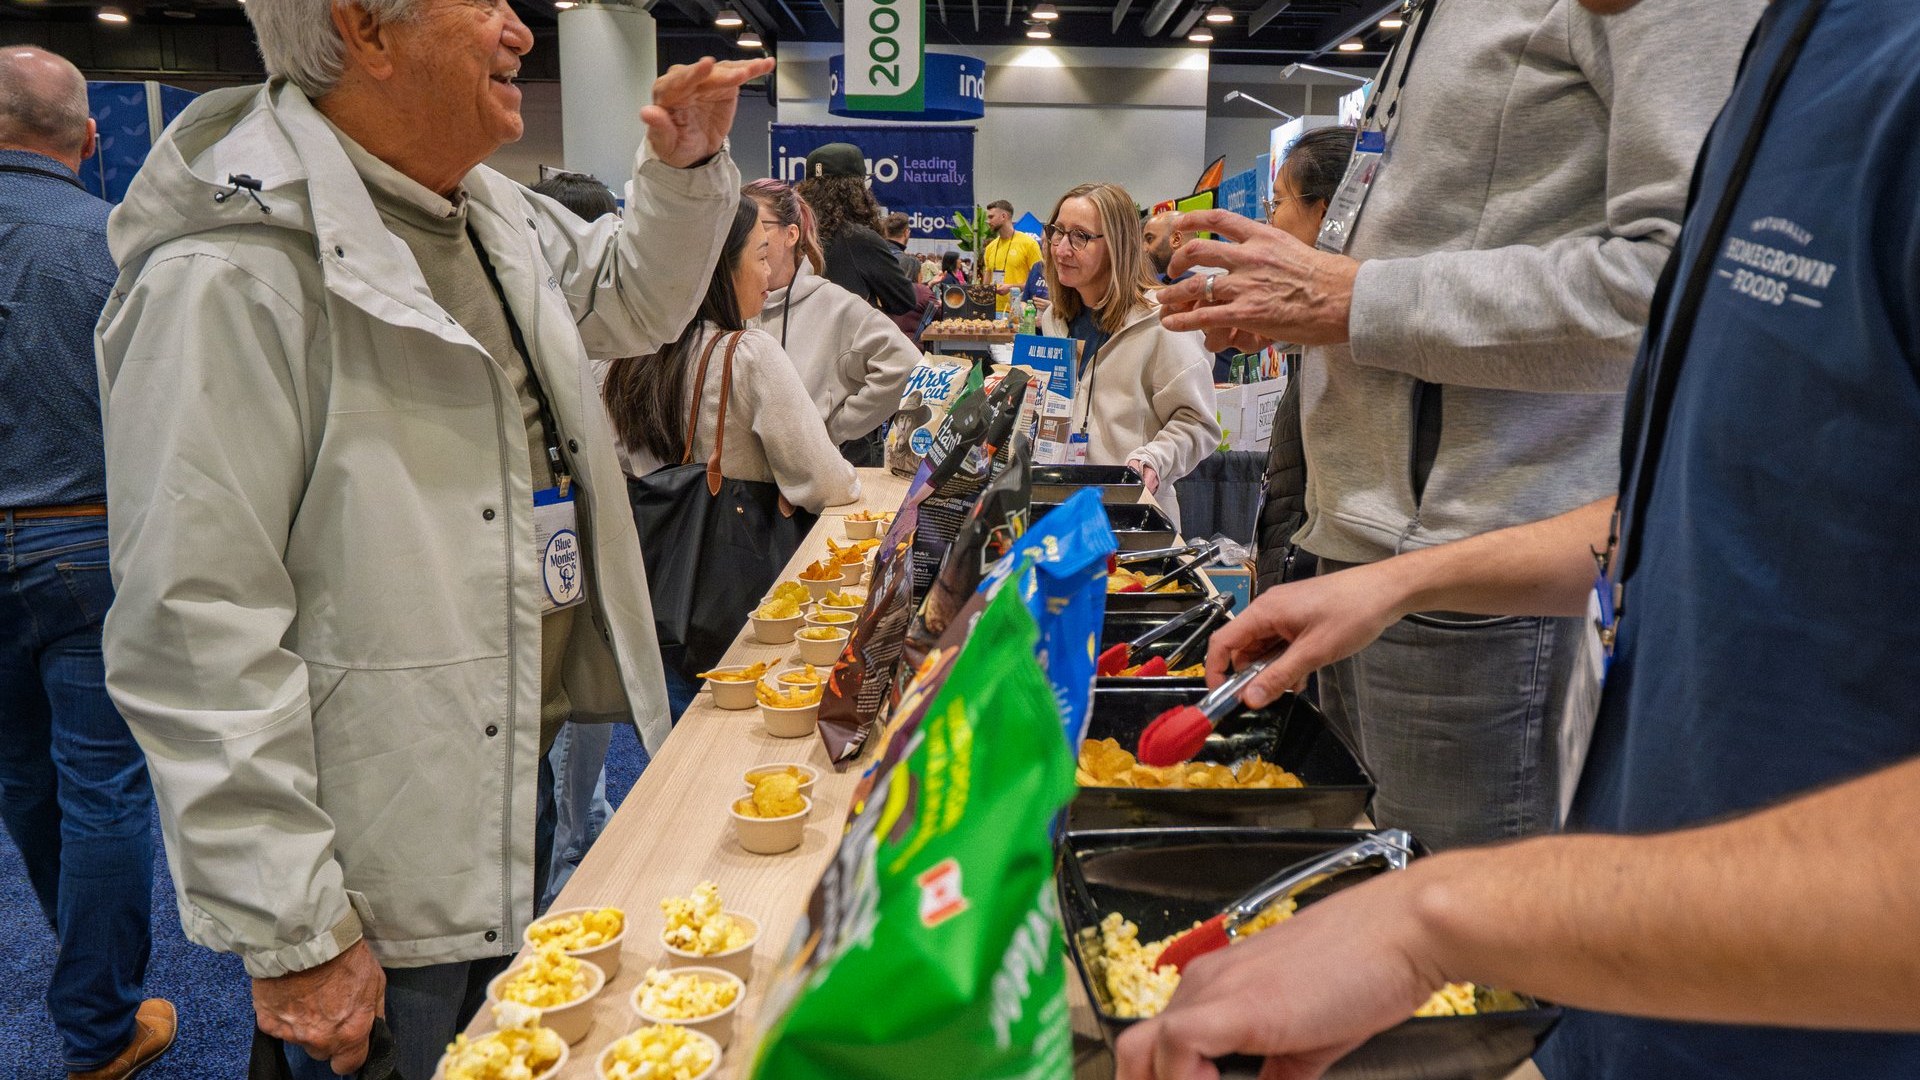
The booth is where the trade show campaign actually meets the customer. Pre-show outreach gets the right people on the floor. Follow-up converts them after. The hours in between, inside the footprint, are where booth engagement either compounds value or quietly leaks it.
This is the second post in the series on plugging the leaks in trade show ROI. The first covered pre-show marketing. This one is about what happens on the floor: why most booths underperform, what engagement actually looks like when it works, and the spatial decisions that turn passive traffic into qualified pipeline.
Most Booths Are Designed for Impressions, Not Booth Engagement
Walk any major exhibition floor and the pattern repeats. Branded backwall. Two collateral racks. A counter with sample bowls and a tablet. Two staff members talking to each other, waiting for someone to approach. Total visitor experience: 90 seconds, one polite handshake, one badge scan, no recall by Tuesday.
The exhibitor measures the show in badge scans. Leadership measures it in cost-per-impression. Neither metric captures what happened, which is mostly nothing.
The Center for Exhibition Industry Research has documented this gap repeatedly: attendees arrive with a clear list of booths they intend to visit (64% specifically research exhibits in advance1), but exhibitors invest disproportionately in being seen rather than in holding attention once seen. The result is a market where booth investment is high and booth-driven pipeline is low.
Dwell Time Is the Engagement Metric That Predicts Pipeline
If a single number tells you whether a booth is converting, it is not foot traffic. It is dwell time.
Research on experiential activations consistently shows that visitors who spend more than five minutes inside an environment are 3.2x more likely to make a purchase within 30 days than those who spend less than two2. The relationship is not linear. It is a step function. The first two minutes register awareness. Minutes two through five build emotional connection. Minutes five and beyond are where purchase intent forms.
That means a 200-visitor day at 90-second touches is not outperforming an 80-visitor day at 8-minute touches. The 80-visitor day generates more qualified leads, despite the smaller denominator. Most booth reports lead with the larger number anyway, because foot traffic is easy to count and dwell is harder. The exhibitors winning the ROI argument at year-end review are the ones who measured the harder thing.
The Three Booth Zones
Engagement does not happen by accident. Every booth that converts at scale is built around the same three-zone architecture, scaled to whatever footprint the budget allows.
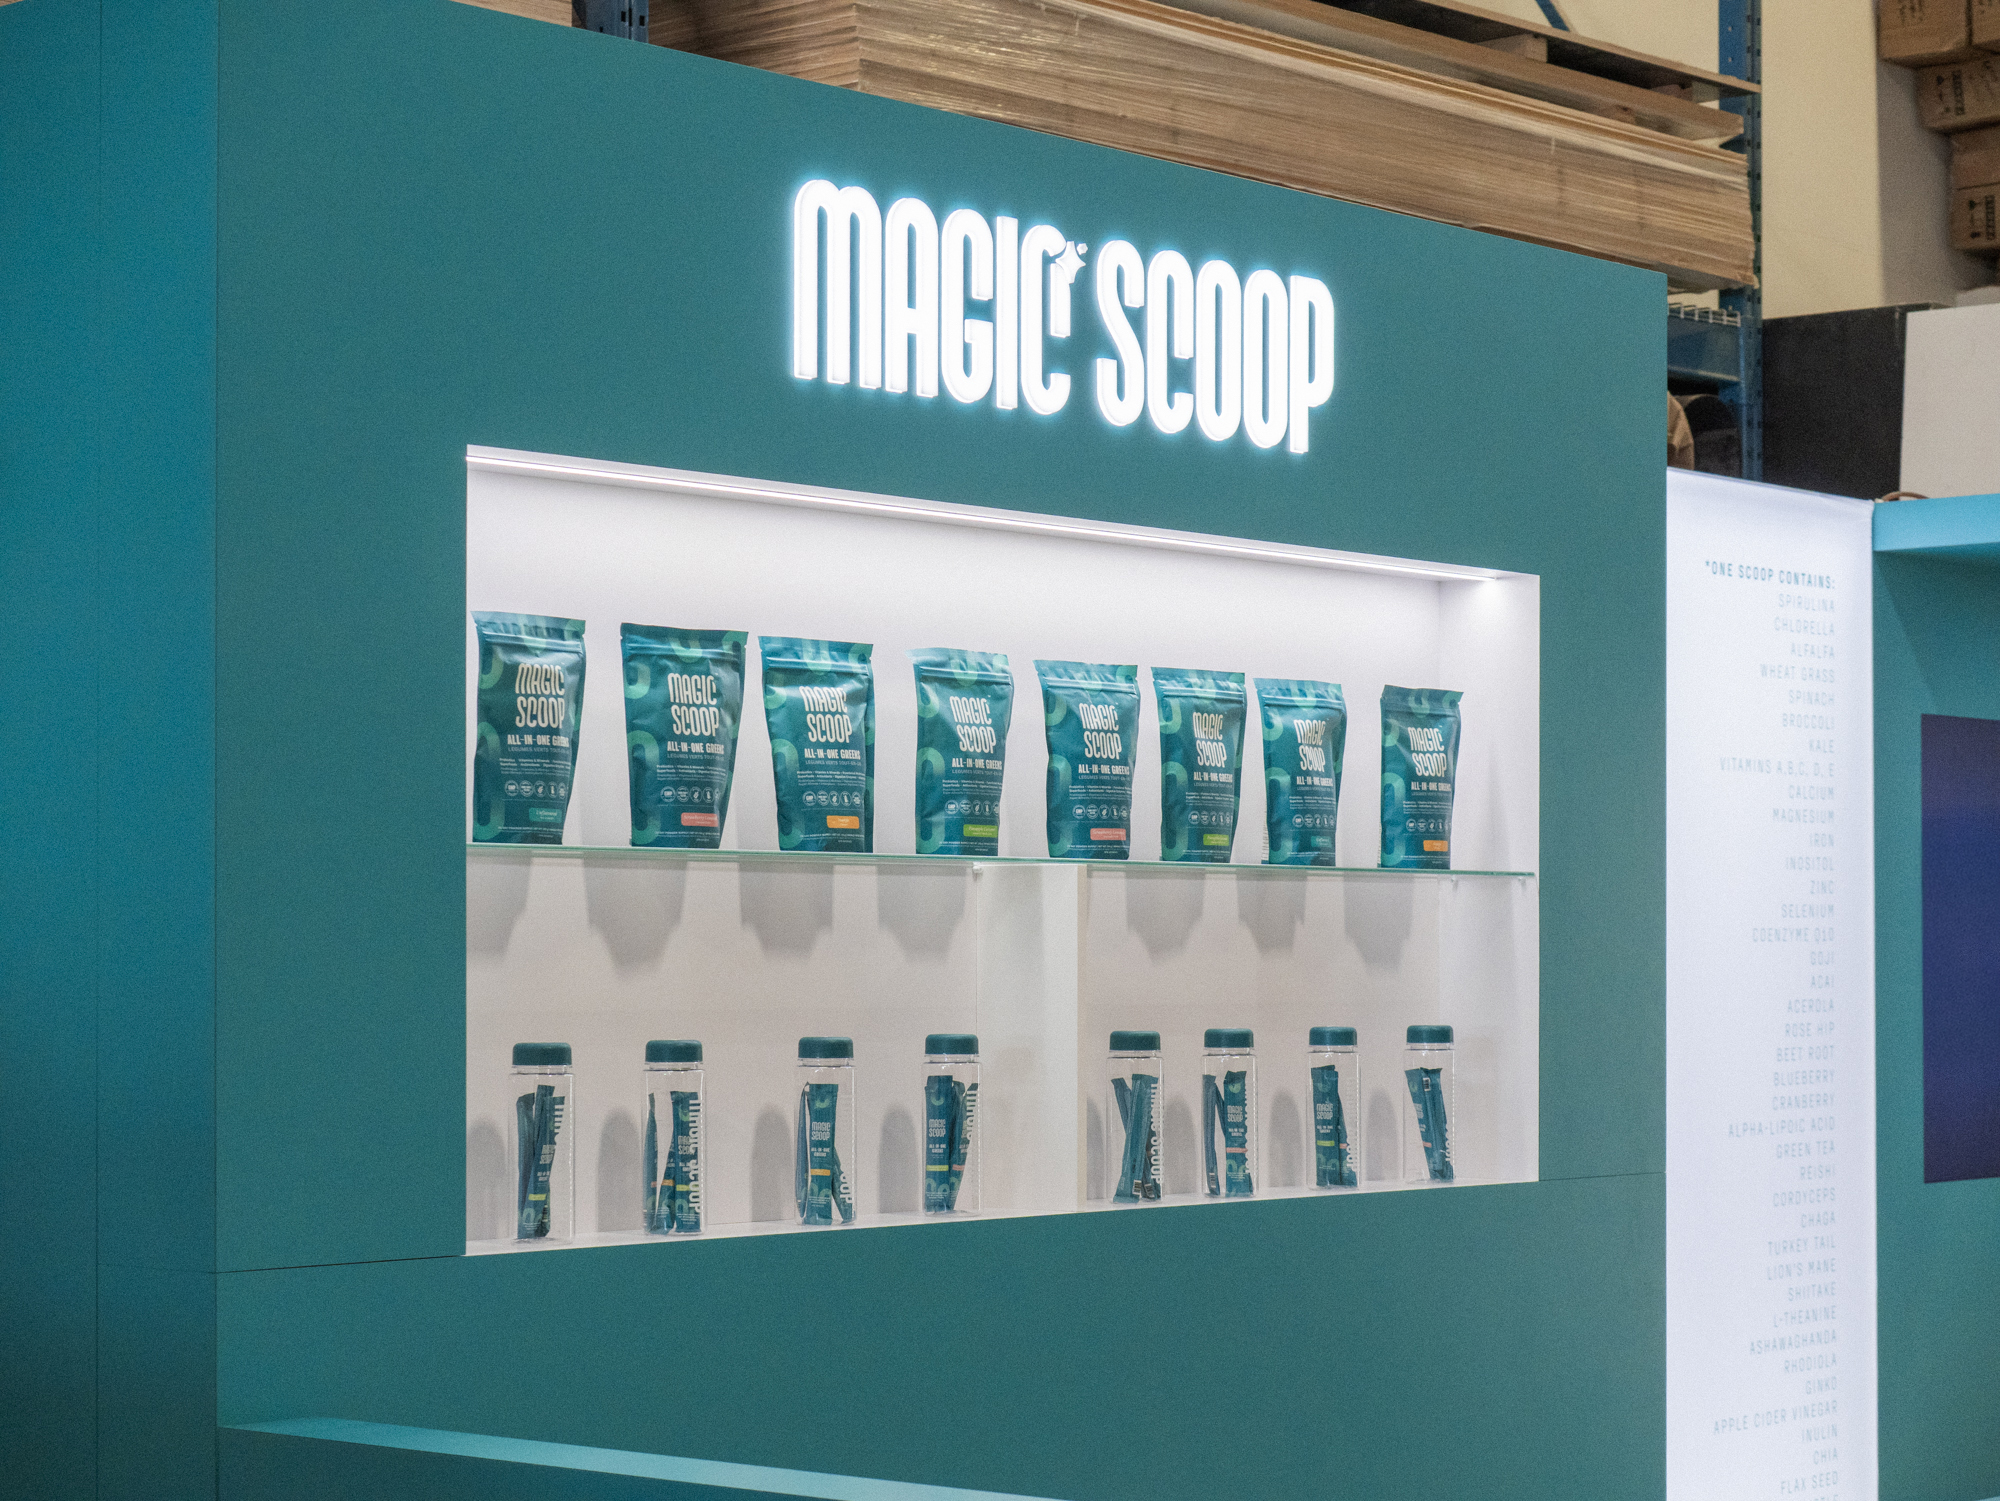
Welcome Zone (the perimeter)
This is where visitors decide whether to enter. Visual draw distance is 50 feet or more. The target is a 40% entry rate from qualified passers-by3. What works: dramatic exterior presence, clear sight lines into the interior so visitors see what awaits, staff positioned at the perimeter with open posture. What fails: staff clustered in the middle looking inward, opaque backwalls that hide the value, signage that reads like an ad rather than an invitation.
Engagement Zone (the interior)
This is where the dwell time accumulates and the emotional encoding happens. Product demonstration, sensory engagement, hands-on interaction. The design discipline is what we call intentional friction: design moves that slow visitors down deliberately, the opposite of retail design that optimizes for throughput.
The data on what works is specific. Counterclockwise flow increases dwell time by 23% over clockwise or unstructured layouts3. Elevated product displays at eye level increase interaction by 40%. Seating areas increase average dwell by 3.5 minutes. Interactive digital touchpoints placed at the midpoint of the journey add two to four minutes when sequenced correctly. The Engagement Zone should consume roughly half the footprint and contain three or more discrete touchpoints. One touchpoint produces awareness. Three produce conversion.
Conversion Zone (the exit)
The final zone is where engagement becomes data. Lead capture, social sharing prompts, takeaway materials. The Conversion Zone should feel like a reward, not a toll booth. The exchange is value for data: exclusive content, personalized recommendations, a tangible takeaway worth talking about. A well-designed Conversion Zone targets a 35% data capture rate on engaged visitors.
The Crowding Paradox
One finding routinely surprises exhibitors new to booth engagement design: more people inside the booth does not mean better performance.
The optimal occupancy range is 60 to 70% of capacity. Below 60%, the space feels empty and visitors question whether it is worth their time. Above 70%, crowding triggers avoidance: shortened visits, reduced staff interaction, lower data capture. The Instagram shot of a line wrapping the aisle is not the proof of success it appears to be. It is evidence of capacity management failure. The exhibitors generating real pipeline control flow, staff for the right density, and accept that a moderately busy booth outperforms a packed one on every metric that matters.
Booth Design Choices That Drive Engagement
Beyond the spatial architecture, four design choices consistently separate booths that engage from booths that do not.
Make the value visible from the aisle
Every booth has roughly three seconds to communicate why a passer-by should stop. Not the company name. The promise. The strongest exhibitors lead with a problem statement or an outcome (“Cut activation cost by 30%”) rather than a brand wordmark visible from across the hall. Brand recognition is the second job; the first is signaling relevance.
Replace passive displays with interactive ones
A printed graphic produces awareness. A demo a visitor can run themselves produces dwell. A configurator that responds to inputs from the visitor produces a story they tell their colleagues at the next break. The investment differential is real, but the ROI differential is larger. Interactive elements give staff a structured way to extend a conversation past the 90-second exit point that kills most booth conversions.
Stage the experience for sharing
Most attendees photograph the booth they liked and post it before they reach the next one. Designing for that moment is not a vanity exercise; it is earned media. A single sight-line moment (a scale-tension element, a material contrast, a piece of bespoke fabrication that reads as real rather than printed) is what drives the photo. Trade show floors are full of foam-core; the booths that get shared are made of materials that look worth sharing.
Treat the booth as the start of a relationship, not the end of a transaction
The booth is the touchpoint where a relationship begins. The product demo, the conversation, the takeaway are all setup for the post-show follow-up that will actually close the deal. Booths designed without that follow-up in mind underperform booths designed with it. The capture flow, the qualification questions, the takeaway content should all anticipate the email that goes out 48 hours later.
From a Booth to an Experience
The exhibitors generating outsized ROI from trade shows have stopped thinking of the booth as a static asset and started thinking of it as a designed experience. Every visitor walks a path that was architected before the doors opened. Every dwell-time choice, every sight line, every staff interaction was rehearsed against a clear conversion goal.
The brands still designing for impressions will keep paying for booth space and wondering why pipeline does not show up. The ones designing for engagement will keep compounding. The math is the same as it has always been; the difference is who measures the things that actually predict the outcome.
Sources
- Center for Exhibition Industry Research, Attendee ROI Playbook Series, Fact Sheet 3: The Power of Pre-Planning and Tracking, 2018.
- Industry research on dwell time and purchase intent, cited in Sequoia, The Complete Guide to Mobile Marketing Tours, 2026.
- Sequoia design framework and operator data, The Complete Guide to Mobile Marketing Tours, 2026. Spatial-behavior findings consistent with environmental psychology research (Underhill, Envirosell).
This is the second post in a four-part series on plugging the leaks in trade show ROI. Want the complete playbook? Download Sequoia’s Trade Show ROI Guide for the full set of frameworks, benchmarks, and worked examples across pre-show, booth engagement, staff performance, and follow-up.