The build is the line item everyone plans for. The insurance increase, the permit delays, the staffing ramp, and the mileage are where mobile tour budgets actually break.
After building mobile tour programs for brands like the Vancouver Canucks, Travis Mathew, and TELUS, we have seen every budget failure mode. Most of them trace back to the same gap: underestimating the operational costs that surround the build itself. Here is the full anatomy.
The Costs Everyone Sees
The visible budget is straightforward. Vehicle acquisition or rental. Fabrication and buildout. Graphic production. Technology integration. Branded merchandise and collateral.
These line items are well understood because they are the ones vendors quote upfront. They are also only part of the picture. The problem is that most teams build their budget as though these quoted items are nearly all of it. That math does not work.
The Costs That Derail Programs
Insurance: The 5x Problem
Event liability insurance has undergone a structural repricing since 2020. Premiums for mobile activations have increased up to 5x prior year rates1, driven by carrier consolidation, higher claim frequency, and tighter underwriting standards.
A mobile tour that crosses provincial or state lines compounds the issue. Each jurisdiction may require separate coverage, additional named insureds, or specific policy endorsements. A program that budgeted for insurance based on historical rates can face two to four times that number under current market conditions.
The fix is not to shop harder. It is to budget for current market reality and build insurance into your planning timeline early. Underwriting for a multi-market mobile tour takes 4 to 8 weeks. Starting that process after the build is underway creates schedule pressure that costs more than the premium itself.
Permits: $500 to $5,000 Per Market
Permitting costs vary wildly by municipality, and the variance is not predictable from the outside. Permit fees range from $500 to $5,000 per market2, depending on jurisdiction, location type, duration, and vehicle classification.
Vancouver, for example, requires separate permits for street occupancy, noise, and temporary structures, each with its own timeline and fee. Toronto’s process differs entirely. U.S. markets add another layer of complexity.
The real cost is not the fee itself. It is the lead time. Most markets require 30 to 90 days advance notice for activation permits. Miss that window and you are either paying expedite fees, rerouting to a less optimal location, or canceling the stop entirely. Budget $1,500 to $3,000 per market as a baseline, plus a 20% contingency for expedite fees and last-minute jurisdiction requirements.
Staffing: The 2 to 3x Multiplier
The staffing line item that most teams budget is the event day cost: brand ambassadors, product specialists, and a tour manager for the activation itself. That figure needs to be multiplied by 2 to 3x to capture the full staffing load.
Total staffing costs run 2 to 3x the event day rate when you account for:
- Pre-event training (typically 1 to 2 days per market, paid)
- Travel days (staff travel to each market, with per diem)
- Setup and teardown labor, often a different crew from the activation team
- Tour manager salary across the full program, not just activation days
- Replacement staff for multi-week tours (burnout and attrition are real)
A 10-market tour with 6 staff per activation looks like 60 staff-days on paper. In practice it is closer to 150 to 180 staff-days once training, travel, and setup are included.
Vehicle Logistics: $0.85 to $1.50 Per Mile
If your activation vehicle has wheels, it needs fuel, a driver, maintenance, and a route plan. Vehicle logistics cost $0.85 to $1.50 per mile2, depending on vehicle size, fuel type, and whether you are using a dedicated driver or contracting transportation separately.
A 10-market tour covering 5,000 miles is $4,250 to $7,500 in logistics alone. That figure does not include overnight parking fees (often $50 to $150 per night in urban markets), weigh station compliance for larger vehicles, or the mechanical contingency you should carry for any vehicle program. For tours using semi-trailers, add $500 to $1,000 per market for staging, leveling, and utility hookups. These are not optional costs. They are operational requirements.
Fixed vs. Variable: A Better Way to Break-Even
Every cost in a mobile tour is either fixed (sunk regardless of how many markets you run) or variable (scales linearly with each activation). Separating the two is the difference between a budget that plans for scale and one that gets surprised by it.
Fixed costs include vehicle acquisition or customization, fabrication and buildout, annual insurance premiums, DOT compliance, core technology infrastructure, initial staff training, and brand asset development.
Variable costs include local permits, staff wages and per diem, fuel and transportation, product inventory and samples, promotional materials, local marketing, and cleaning and restocking between activations.
The break-even formula that follows is simple: Break-Even Markets = Fixed Costs ÷ (Revenue Per Market − Variable Cost Per Market). A $150,000 fixed cost base against $18,000 revenue and $8,000 variable per market breaks even at 15 markets3. If your tour footprint is smaller than that number, the economics do not work at that build spec. Scale the build down, or scale the tour up.
CapEx Sharing: The Cost Reduction Nobody Uses
One of the most effective budget strategies distributes the capital expenditure across the multiple departments that will use the asset. A mobile tour vehicle is rarely a marketing expense alone. It serves Sales, HR, and sometimes Operations.
Typical allocation across a shared asset3:
- Marketing (~60%): brand activations, product launches, consumer events, festivals, social content
- Sales (~25%): client hospitality, trade show presence, dealer roadshows, B2B demos
- HR & Culture (~15%): recruitment tours, campus activations, employer branding, internal events
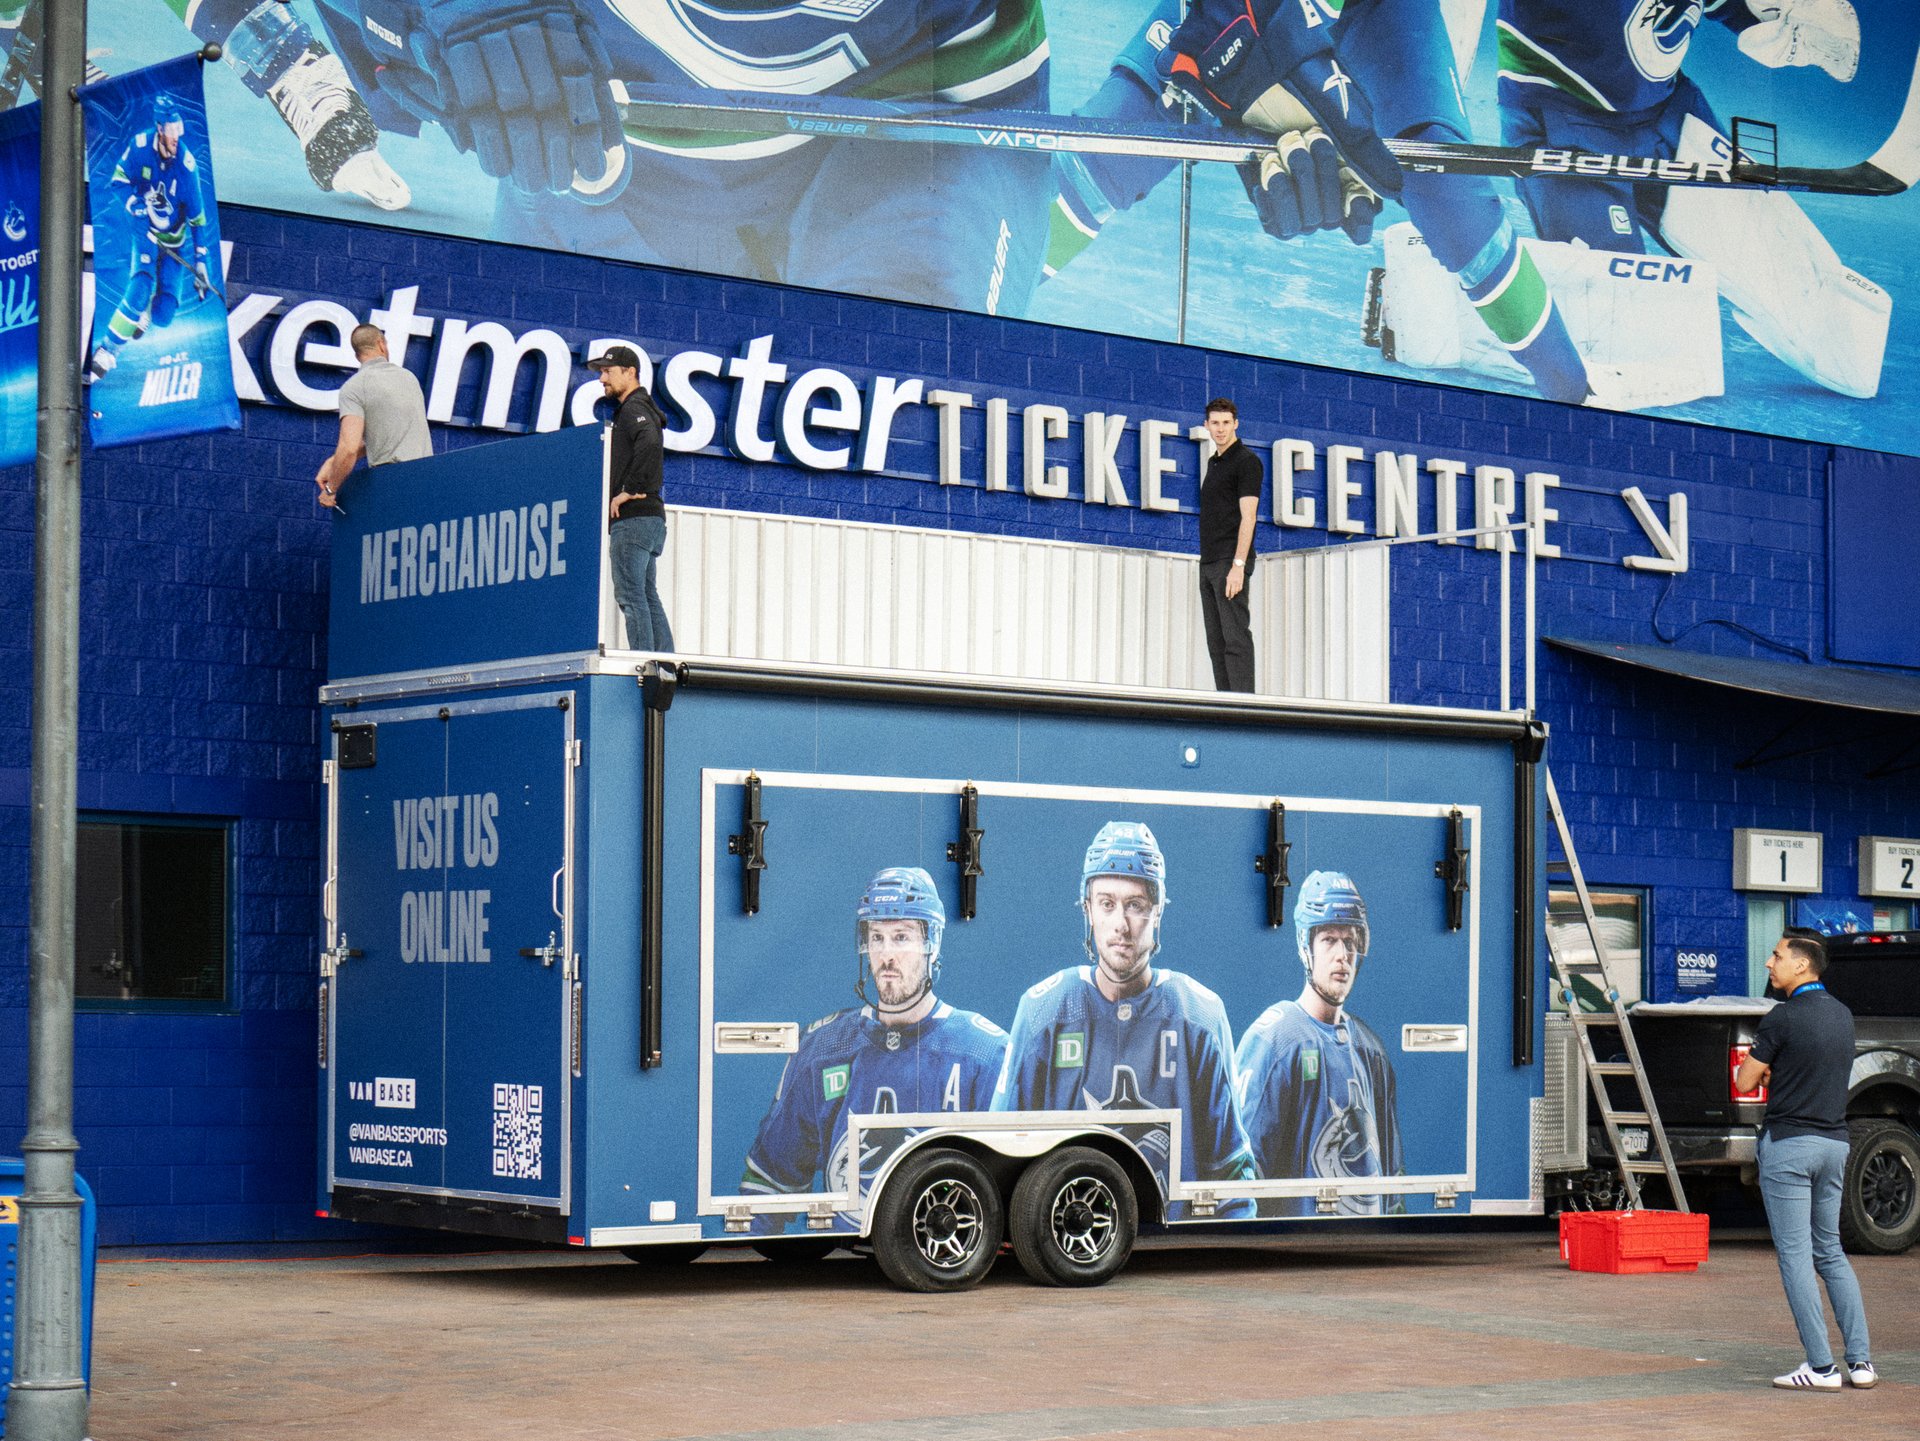
Designed for dual-purpose from day one, shared assets meaningfully reduce overall program cost. When the Vancouver Canucks built their modular activation system with Sequoia, the asset served fan engagement, corporate partnerships, and permanent retail. It delivered 3x asset utilization compared to a single-purpose build. That is not creative accounting. It is accurate attribution. If three departments use the asset, three departments should fund it.
Building a Mobile Tour Budget That Holds
The difference between a budget that holds and one that does not is not conservatism. It is completeness.
Split the build from everything that surrounds it. Break hidden costs into per-market line items so they scale with your tour footprint. Build insurance and permitting timelines into your project plan, not just your spreadsheet. Staff for the full program lifecycle, not just activation days.
And if the total comes in above your approved budget, scale the build to fit the real number. Programs in the $50,000 to $150,000 range can achieve 70 to 80% of the engagement metrics of premium builds3 when designed strategically. A well-executed modest program outperforms an ambitious one that runs out of money in market six.
The hidden costs are only hidden if you have not seen them before. Now you have.
Sources
- Operator-reported insurance premium increases for mobile activations, consistent with Insurance Information Institute analyses of event-liability carrier consolidation post-2020. Cited in Sequoia, The Complete Guide to Mobile Marketing Tours, 2026.
- Sequoia operator data on permitting and vehicle logistics benchmarks, The Complete Guide to Mobile Marketing Tours, 2026.
- Sequoia budget framework and Vancouver Canucks case study, The Complete Guide to Mobile Marketing Tours, 2026.
Want the full budget model, per-market benchmarks, and the case studies behind these numbers? Download The Complete Guide to Mobile Marketing Tours for 62 pages of frameworks, formulas, and worked examples from brands like the Vancouver Canucks and Travis Mathew.