Bring the Brand to the Customer.
Marketing budgets are flat, ad fatigue is real, and consumers tune out one channel after another. The brands gaining ground are showing up in person.
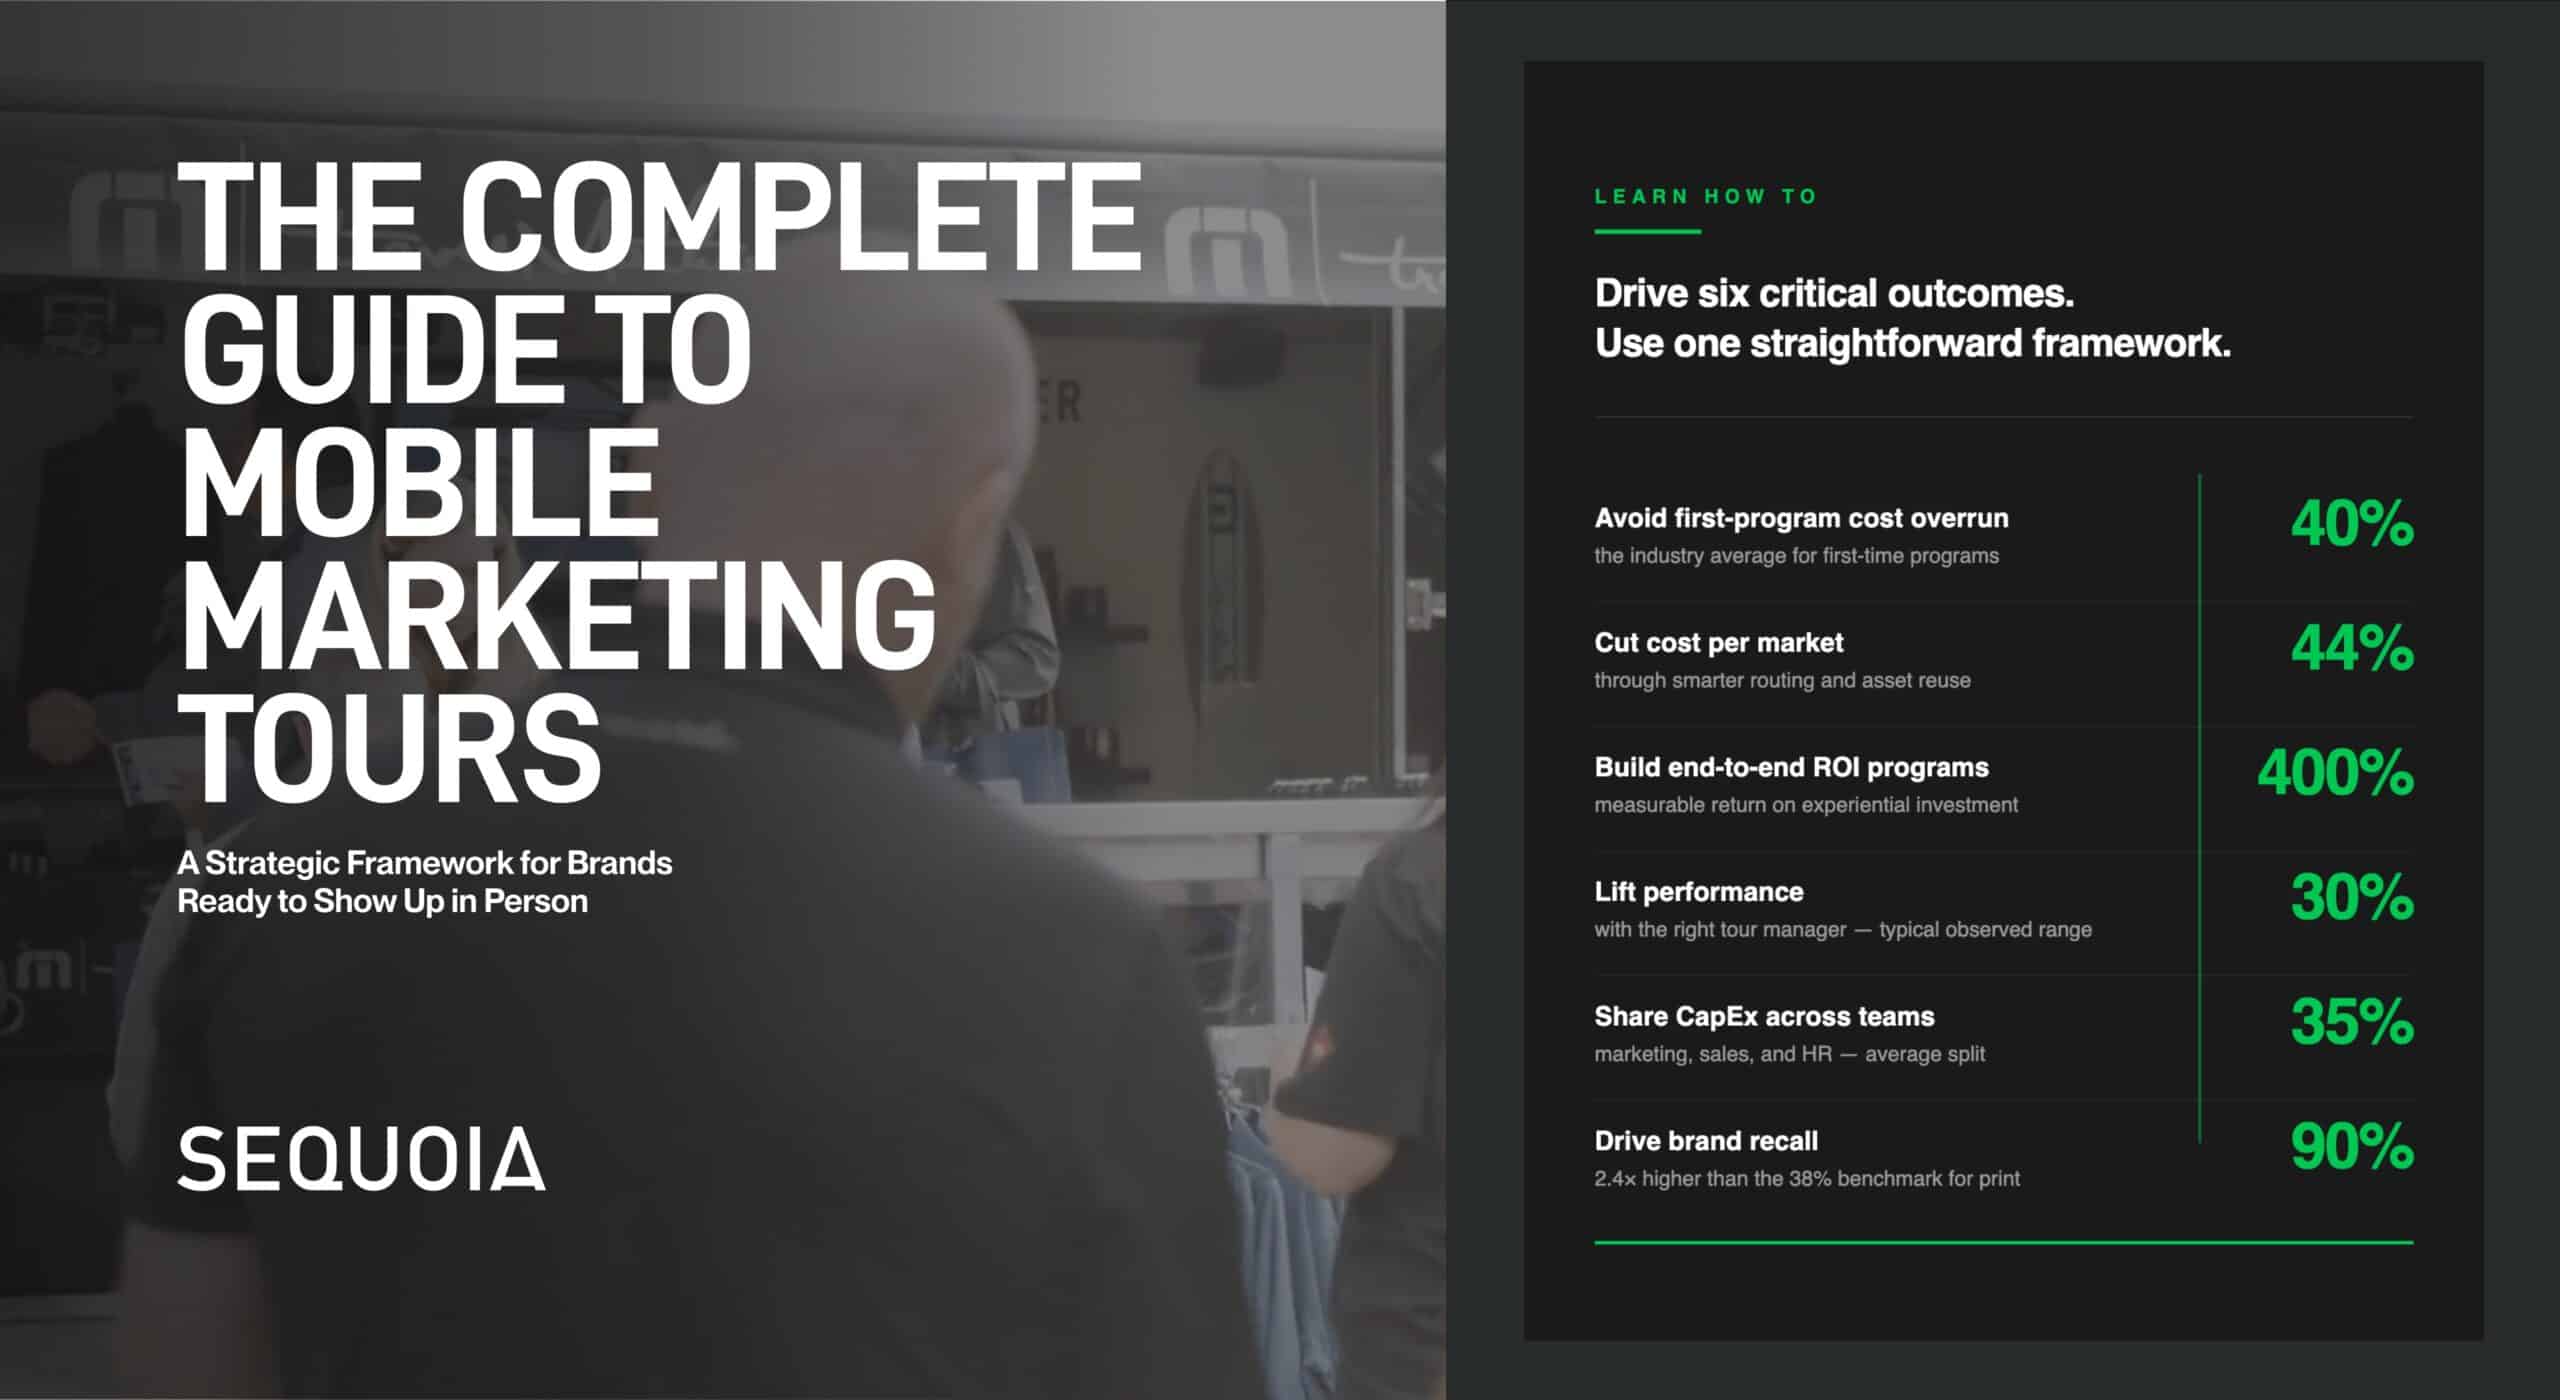
But mobile tours are operationally complex. Vehicle selection, route economics, the insurance gap, staffing, dwell-time design, ROI measurement. The leak points are spread across seven workstreams, and most first-time programs underestimate true cost by 40-60%.
This guide gives you the framework top-performing teams use to plan, build, and measure a mobile marketing tour that actually returns 4:1.
What’s Inside
The Five Decisions That Determine Whether a Mobile Tour Returns 4:1 or Bleeds Cash
What’s Inside
The Five Decisions That Determine Whether a Mobile Tour Returns 4:1 or Bleeds Cash
The Business Case (Why Mobile Wins on the Math)
- Why top-performing experiential programs return 4:1 versus 2:1 for traditional advertising
- The recall gap: 90% experiential vs. 38% print. The the gap widens at 30 days
- The B2C/B2B spend numbers driving Fortune 1000 budget reallocation in 2024
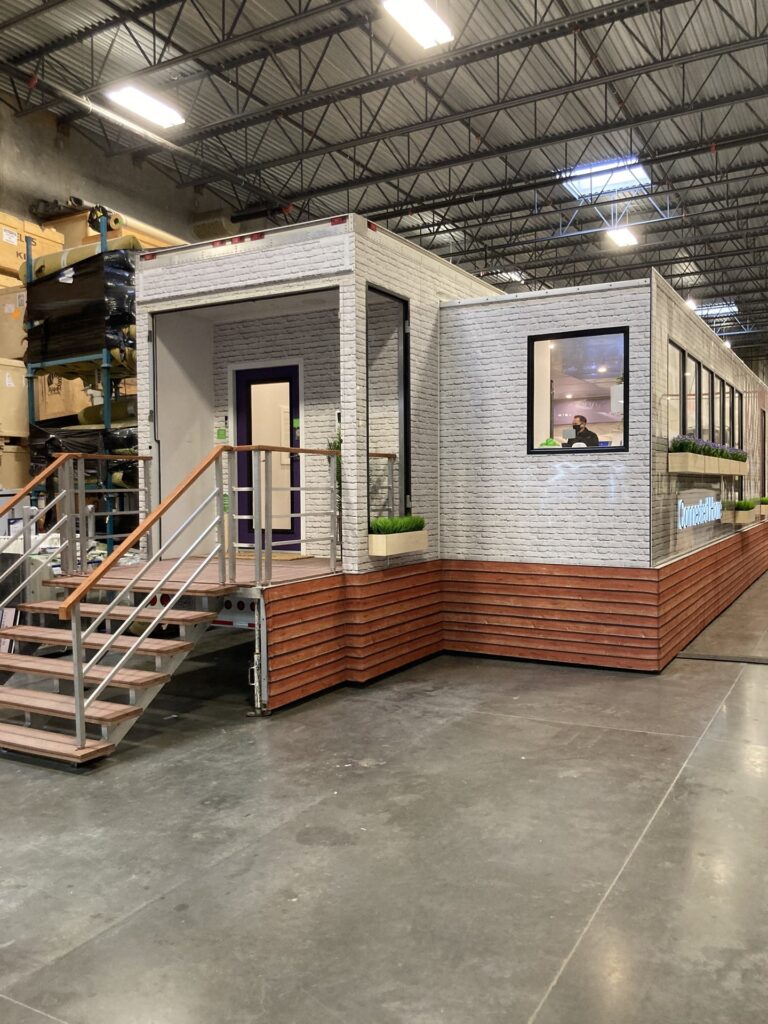
Vehicle Selection & True Cost of Ownership
- 5-year TCO benchmarks across 8 vehicle platforms , from Sprinter van to expandable semi-trailer
- Rental vs. custom build break-even math (rental wins under ~10 activations/year)
- The hidden costs that derail first-time programs: permits, insurance, DOT compliance, storage
Route, Markets & Seasonal Timing
- The 7-criteria weighted scoring model for ranking which markets to actually hit
- Why tight clustering cuts cost-per-market by 44% vs. scattered national deployment
- Q1-Q4 seasonal playbook: when to chase peak traffic and when to counter-program
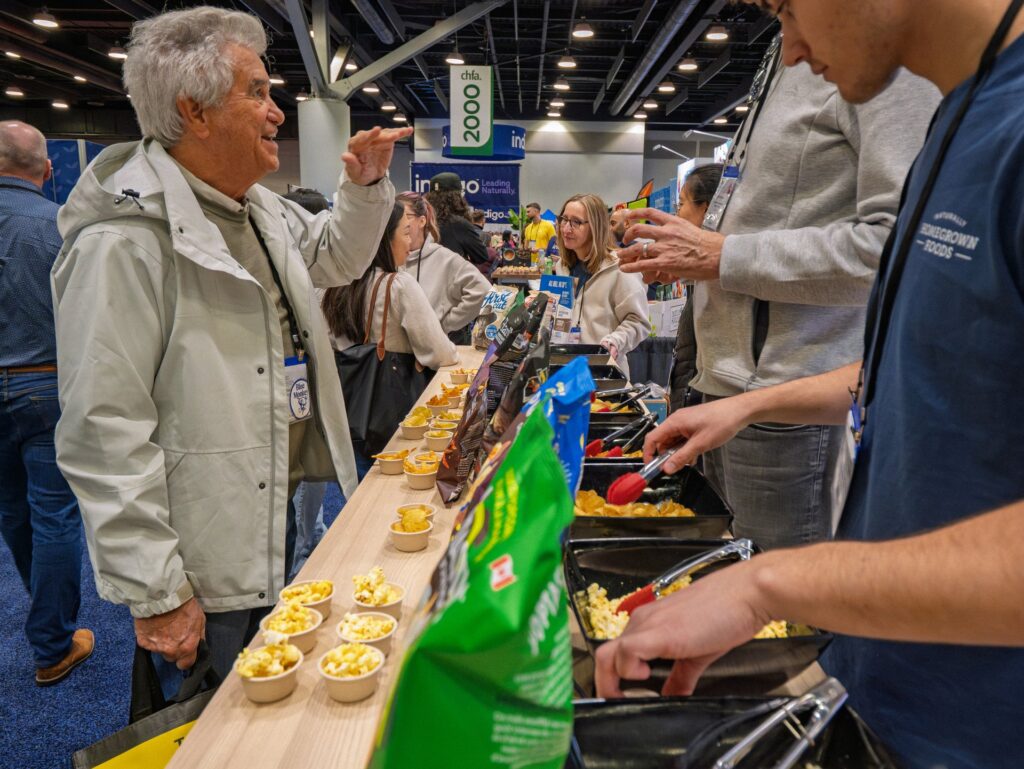
Staffing, Dwell Time & Activation Design
- Staff-to-consumer ratios for five activation types , from 1:3 product demo to 1:12 self-guided
- The 3-zone consumer journey (Welcome / Engagement / Conversion) and the dwell-time targets for each
- Why a strong tour manager improves overall program performance by 25-35%
Measurement, ROI & Asset Lifecycle
- The 5-tier measurement stack , from approach rate through 6-month sales lift
- Cost Per Qualified Engagement (CPQE) , the formula that holds up in a CFO review
- How dual-purpose asset design unlocks 30-40% cost reduction by sharing capex across Marketing, Sales, and HR
Inside This 56-Page Strategic Guide
Built on cited research and Sequoia operator data, viewed through the lens of extensive industry experience.
- •A complete TCO model across 8 vehicle platforms: Sprinter through expandable semi-trailer
- •The route-clustering math that cuts cost-per-market by up to 44%
- •Dwell-time-to-purchase data from real activation programs (the curve, not the average)
- •Budget allocation benchmarks for 10-market regional and 25-market national tours
- •A 16-week launch timeline across 7 parallel workstreams: strategy, vehicle, staffing, permits, technology, marketing, operations
A Team With Decades of Mobile Tour, Showroom & Activation Experience
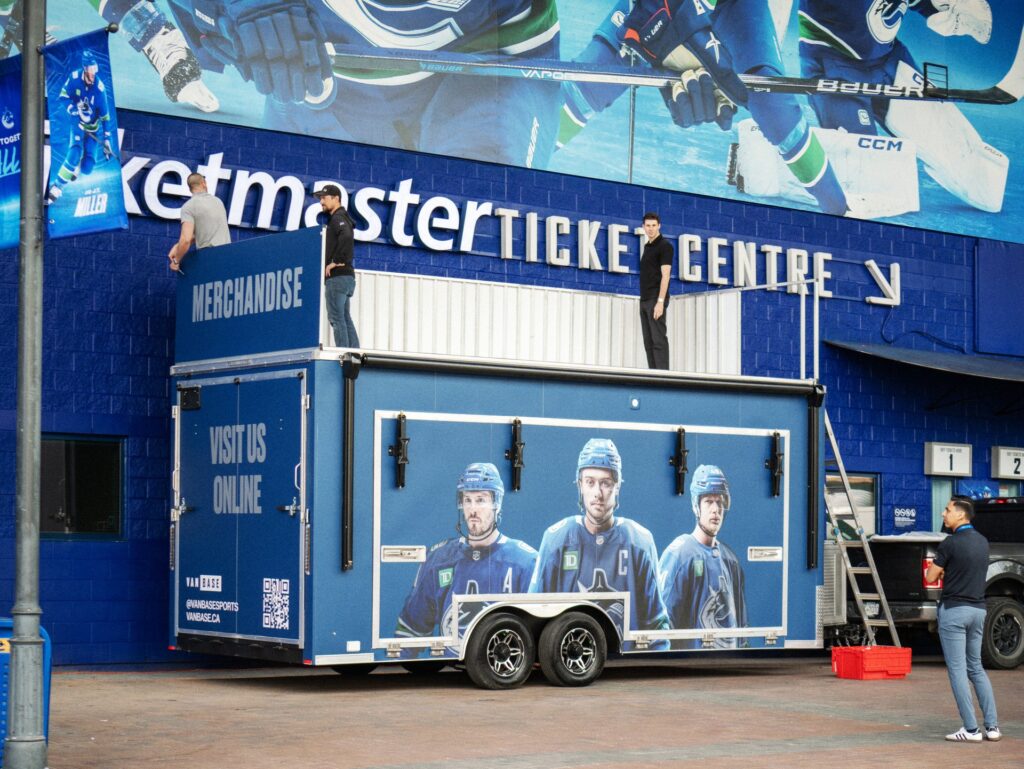
Built from primary research, operator data, and Sequoia’s vertically integrated fabrication shop , the same shop that has shipped tours for Telus, the Vancouver Canucks, Travis Mathew, Beedie, the Vancouver Whitecaps, and dozens of other brands across North America.

Most mobile tour programs don’t fail because the vehicle is wrong.
They fail because the system around it is incomplete: market selection chosen on instinct, budgets that miss 40-60% of true cost, staff trained the night before, and measurement bolted on after teardown.
This guide gives you the framework to design the whole system , so the vehicle becomes the visible part of a program that actually compounds.
Is This Guide For You?
- CMOs and brand leaders evaluating mobile tours, mobile showrooms, or experiential road programs for the first time
- Marketing directors who already run mobile activations and need to defend ROI to a CFO
- Brand and event teams comparing custom-build vs. rental vs. modular platforms
- Sales and field-marketing leaders running B2B mobile demos, dealer roadshows, or campus recruitment tours
- Agencies and producers scoping a mobile tour program for a client and pricing the full lifecycle
Download The Mobile Tours Guide
The complete 56-page strategic framework. Vehicle TCO, route economics, dwell-time data, and the 16-week launch playbook.
What Clients Say About Working With Sequoia
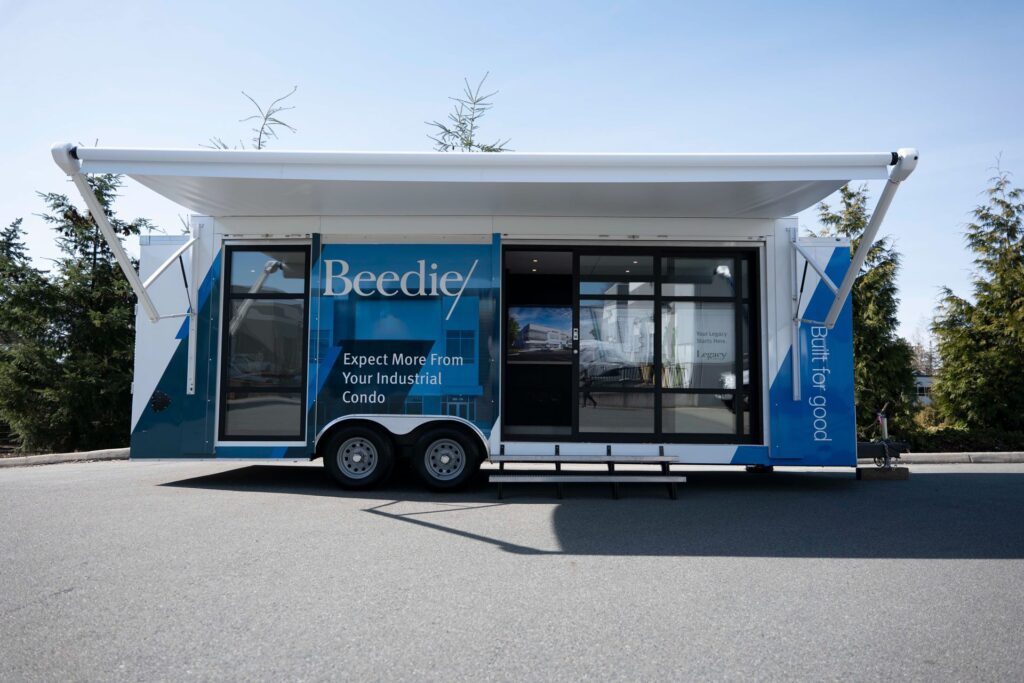
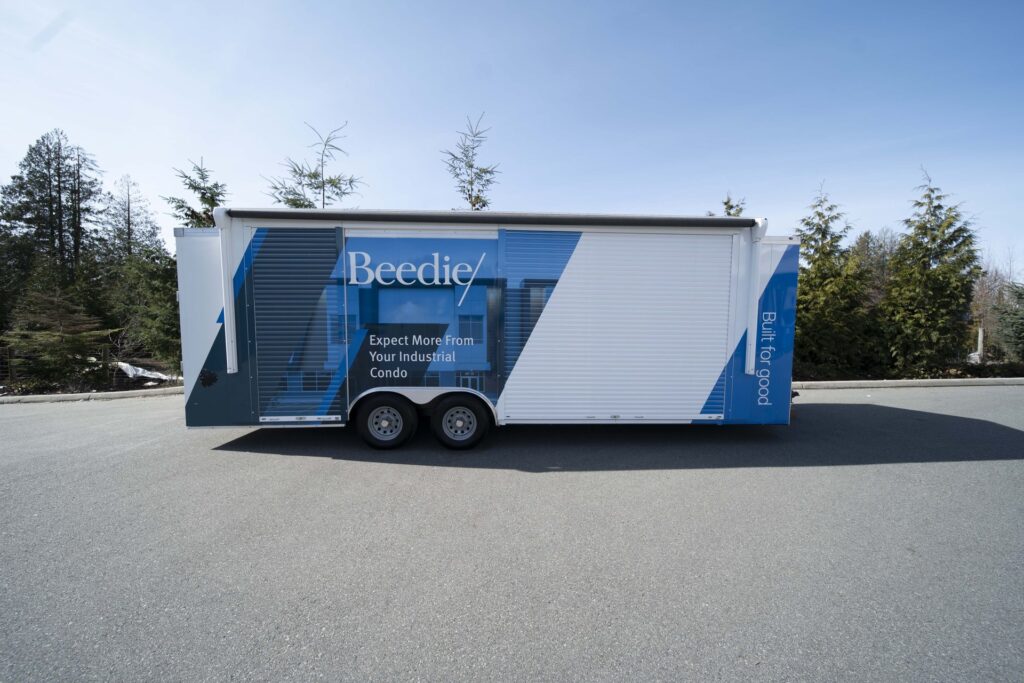
Diana George, Senior Workplace Design Strategist, Beedie“I had the pleasure of working with Sequoia while designing our very first Sales and Marketing trailer for Toronto. They were extremely attentive to our design thought process and ensured that all of our needs from design intent to functionality were met. Peter and Cory helped work out details that seemed impossible to build. Everyone here at Beedie is extremely impressed with build quality of the trailer.”
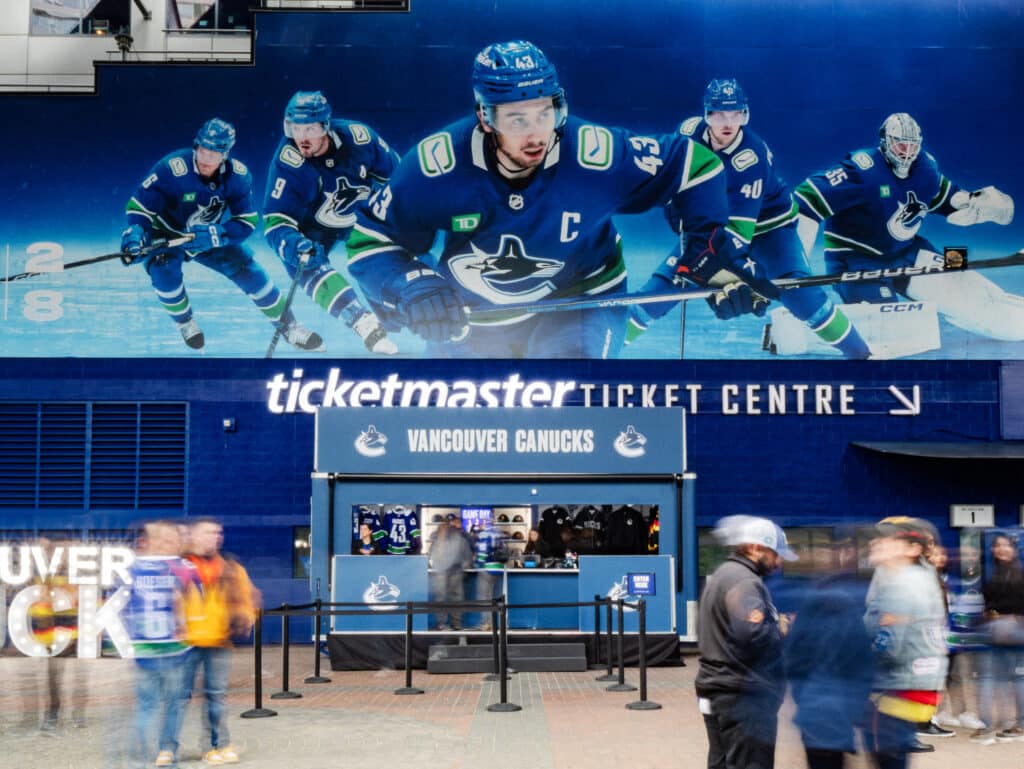
Jill White, Director, Merchandise, Canucks Sports & Entertainment“Collaborating with Sequoia on the Vancouver Canucks trailer project was a great experience. Their team offered flexibility and insightful guidance, helping us manage our evolving needs.”
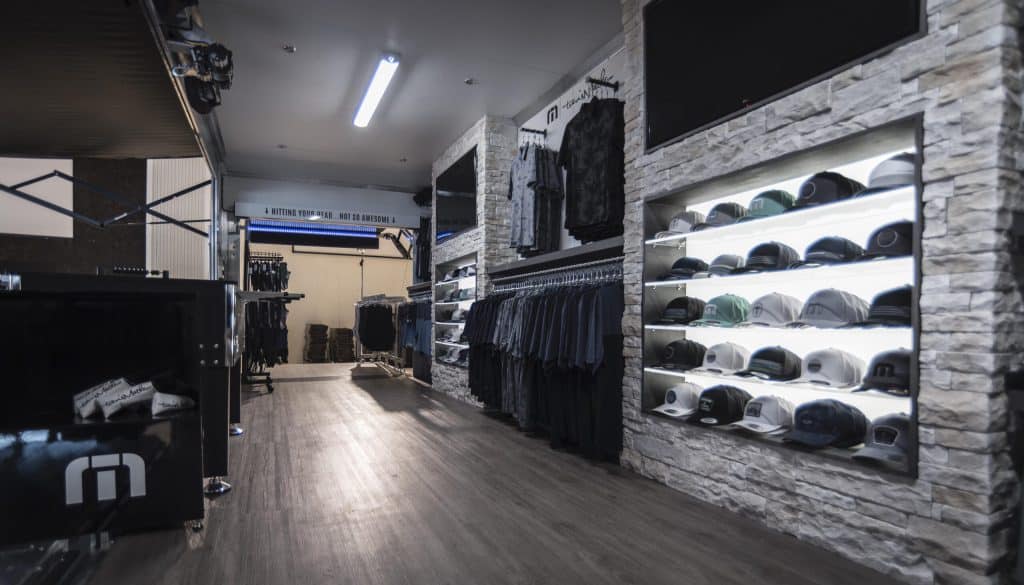
Brad German, President, G&G Brands (Travis Mathew Canada)“I cannot say enough good things about the entire team at Sequoia, who really took a vision that we had and turned it into reality. Creating from scratch a 35′ mobile store that had never been done before was no simple task and Sequoia was a part of every aspect from design to manufacturing. We at G&G Brands couldn’t be happier with the finished product.”
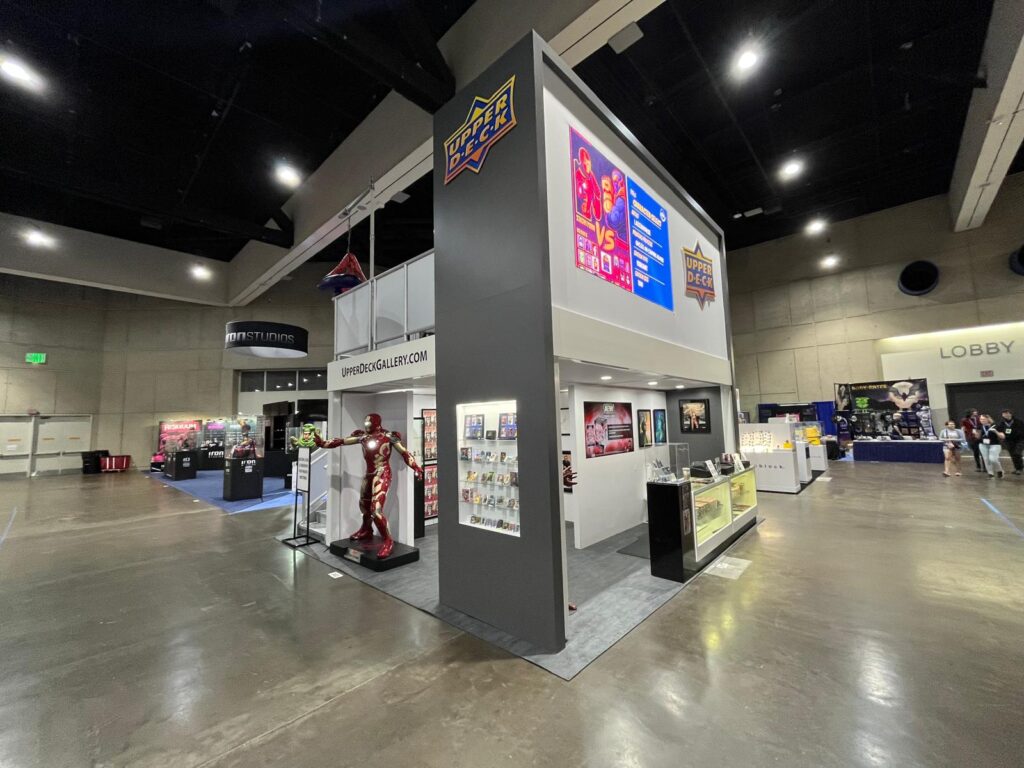
Paul Nguyen, Upper Deck“Sequoia continues to deliver creative, flexible spaces that provide an ideal showcase for our product, managing to effectively attract attention and efficiently handle our event traffic.”
The Numbers Don’t Lie
of consumers more likely to purchase after participating in a brand experience
brand recall rate from experiential marketing, vs. 38% for print and 45% for digital display
average ROI on top-performing experiential programs, vs. 2:1 for traditional advertising
B2C experiential spend in 2024, up 10.3% year-over-year (B2B reached $38B, up 11%)
Mobile tours win on the math: when you measure the right things. The data below is from the most recent published sources tracking experiential and mobile activation performance.
About Sequoia
Sequoia’s team brings decades of combined experience designing, fabricating, and operating mobile tours, showrooms, and brand activations for Telus, the Vancouver Canucks, Travis Mathew, Beedie, the Vancouver Whitecaps, Arc’teryx, Cadillac Fairview, and dozens of other brands across North America.
We’re vertically integrated , strategy, design, fabrication, and field operations under one roof in Vancouver. That’s the difference between a fabricator who builds what you ask for and a partner who builds the program around what you actually need to measure.
This guide is the framework we hand clients on day one. We don’t just build vehicles. We build mobile programs that perform.
Ready to Hit the Road?
Download the 56-page Mobile Marketing Tours guide for the full framework , or skip ahead and contact us to discuss your mobile tour program. From concept through fabrication and logistics, we bring decades of combined experiential expertise to every build.